
Harmonic Content Versus the Bandwidth That Your Engineers Require
July 07, 2017
 |
Harmonic signals are generated by almost every high-frequency signal source with sufficient bandwidth, no matter how well designed. Any signal source with more than one octave bandwidth is capable of producing harmonic outputs. The harmonics can be removed by means of lowpass filters, but first they must be identified. A spectrum analyzer is usually the test instrument of choice for measuring harmonic signals. An instrument with sufficient bandwidth can display a fundamental signal and a number of its harmonic signals simultaneously to simplify identification of harmonics. The number of harmonics that can be displayed for a particular fundamental-frequency signal will depend upon the frequency range or bandwidth of the analyzer.
Harmonics are generated as the result of the nonlinear behavior of active devices, such as diodes and transistors, and components based on them. They may be desirable, such as when used for frequency multiplication to generate higher-frequency outputs from a lower-frequency signal source, or for harmonic mixing in receivers and transmitters for downconversion and upconversion purposes, respectively. But they can also be unwanted, such as when input signals to a wideband amplifier produce unexpected harmonic output signals that can act as interference to communications systems.
The fundamental frequency is sometimes referred to as the first harmonic frequency. Harmonic frequencies are periodic at the fundamental frequency, such as 1 GHz, 2 GHz, 3 GHz, or nf0, where f0 is the fundamental frequency and n = 1, 2, 3,… is the order of the harmonic frequency.
The amplitudes of harmonic signals can follow a logarithmic progression for certain waveforms from their starting points, with second harmonics being about 2 dB less in amplitude than fundamental signals, third harmonics about 3 dB less than fundamental signals, and so on. In theory, the number of harmonic signals produced by a nonlinear source, specifically a square wave, in a true harmonic series is infinite. In practical applications, higher-order harmonics (such as fifth- or sixth-harmonic signals) can generally be ignored because their amplitudes will approach the noise floor or an application system as well as the spectrum analyzers used to measure them.
Scanning the Spectrum
To accurately measure harmonic signals with a spectrum analyzer, it is important to know that the analyzer itself is not a source of harmonics. Microwave spectrum analyzers rely on nonlinear components such as mixers for frequency conversion will cause harmonic distortion. Through the use of filtering, a well-designed spectrum analyzer will prevent its own harmonic signals from becoming part of a harmonic frequency measurement, as is usually documented by the harmonic-level specification in a spectrum or signal analyzer data sheet.
How do RF/microwave spectrum analyzers fare with harmonic signal measurements? Product data sheets usually provide sufficient details concerning the performance parameters that will have the most impact on harmonic measurements. It may help to review key specifications for some popular spectrum/signal analyzers and how those specifications translate into harmonic measurement capability. Among those specifications are video bandwidth, resolution bandwidths (RBWs), displayed average noise level (DANL) with differing sweep speeds.
As an example, the Keysight/Agilent 8565EC spectrum analyzer is part of the company’s 8560EC series of analyzers. It has a measurement range of 30 Hz to 50 GHz, which enables detection and display up to the fifth harmonic for 10-GHz fundamental-frequency signals. The well-designed analyzer suppresses any harmonics from its own front-end circuitry by at least 92 dB for the highest-amplitude harmonics at the lowest frequencies
The 8565EC spectrum analyzer offers resolution-bandwidth (RBW) filters from 1 Hz to 1 MHz in 1, 3, 10 sequence as well as 2-MHz RBW filters, with sweep speeds that can be set from about 50 ms to as long as 2000 s with RBW filters and from 50 μs to 6000 s in zero-span (0-Hz) sweep mode. It provides a wide dynamic range for detecting low-level signals, with a displayed average noise level (DANL) of -127 dBm or better (with a 1-Hz RBW filter) at the highest frequencies, and considerably better below 22 GHz.
For any spectrum analyzer used for harmonic measurements, tradeoffs between sweep speed and filtering requirements should be weighed. Higher-order harmonic signals will be at the lowest amplitudes, requiring the lowest measurement noise floor for detection. The noise floor for a given signal is lowered through the use of narrower RBW filters, although this results in longer sweep time, which can be an important consideration when looking for multiple harmonic signals over a wide bandwidth. Also worth noting when comparing analyzer DANLs: the DANL is a function of RBW, and an analyzer’s DANL specifications will be referenced to a specific RBW. A narrower RBW filter will yield a lower DANL.
Some users may be working in a clearly defined fundamental-frequency band, such as 2450 MHz for WLANs, and will have a good idea of the harmonic frequencies of concern within their systems based on their receiver and transmitter architectures and local oscillator (LO) frequencies. To assist them, some test instrument manufacturers provide spectrum or signal analyzers, which are fundamentally the same instrument, but available for different frequency ranges. Rohde and Schwarz FSUP signal source analyzers, for example, include three models with frequency ranges of 1 MHz to 8 GHz, 1 MHz to 26.5 GHz, and 1 MHz to 50 GHz, so a user can decide upon the bandwidth needed according to the test requirements, such as the number of harmonics for a given fundamental frequency.
The Rohde & Schwarz FSUP26 signal source analyzer is one member of the instrument family, with a DC-coupled frequency range of 20 Hz to 26.5 GHz and an AC-coupled frequency range of 10 MHz to 26.5 GHz. It has enough bandwidth to display fifth harmonics for fundamental signals to 5 GHz and higher, with low-enough noise to show low-level higher-order harmonics: its displayed average noise level (DANL) is -145 dBm or better at the highest frequencies. Sweep times range from 1 μs to 16,000 s when using RBW filters.
In general, for practical harmonic measurements, an analyzer’s upper frequency limit divided by three will give a good idea of the usable fundamental-frequency test range. For Keysight Technologies’ E4440A PSA Series spectrum analyzer, with a DC-coupled frequency range of 3 Hz to 26.5 GHz, measurements involving fundamental frequencies to about 8.8 GHz can include second- and third-harmonic signals.
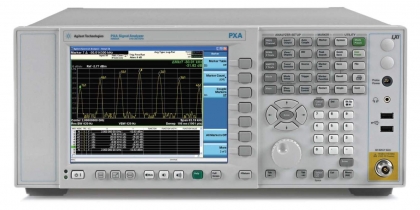
Similarly, the Keysight E4407B spectrum analyzer has a DC-coupled frequency range of 10 Hz to 26.5 GHz for measurements to the fifth harmonics for fundamental-frequency signals to 5.3 GHz. Both analyzers include a wide range of RBW filters for limiting noise and interference. For the E4407B spectrum analyzer, the DANL through 26.5 GHz is -106 dBm with a 1-kHz RBW filter and -125 dBm with a 10-Hz RBW filter, although the sweep time increases for a given bandwidth with a narrower RBW filter. For those wishing to specify an instrument with just enough bandwidth for an application, Keysight’s N9030A PXA X-Series signal analyzers are available in versions from as narrow as 3 Hz to 3.6 GHz and as wide as 3 Hz to 50 GHz.
Spectrum analyzer sweep speeds become even more significant when harmonic signals are short in duration. Although harmonics are associated with periodic waveforms, such as sine waves, nonlinear effects can also produce pulsed-signal harmonics. A large number of sweeps will be needed to ensure that all of a pulsed-signal’s harmonics have been detected. In addition, the RBW should be set so that the spectral length or sweep speed does not exceed the pulse width of the fundamental-frequency signal to be measured. A large number of fast analyzer sweeps can help measure the harmonics of even low-duty-cycle pulsed waveforms, using enough bandwidth to capture the desired number of harmonic signals.
Admittedly, the information provided on these signal and spectrum analyzers has been extremely limited and geared towards their use for harmonic signal measurements. More information on these and other analyzers, including downloadable data sheets, is availabile on individual product pages or by contacting Axiom Test Equipment’s sales department at sales@axiomtest.com or by calling 760-806-6600.
Back to BLOG